

Interactive Infographics: Examples + Tips To Boost Engagement
Have you ever come across one or two mind-blowing interactive infographics that left you feeling like you just went on a journey to another dimension?
They are visual representations of data that are designed to be more immersive and engaging than traditional infographics.
They allow users to interact with the data, giving them an informative and entertaining hands-on experience.
Now, you may be wondering, how do I create such amazing interactive infographics?
Today, we will delve into the art of creating outstanding interactive infographics.
We will explore the benefits of interactive infographics for engagement, and most importantly, we will uncover the secrets of “how to make interactive infographics amazing!”
Examples Of Interactive Infographics
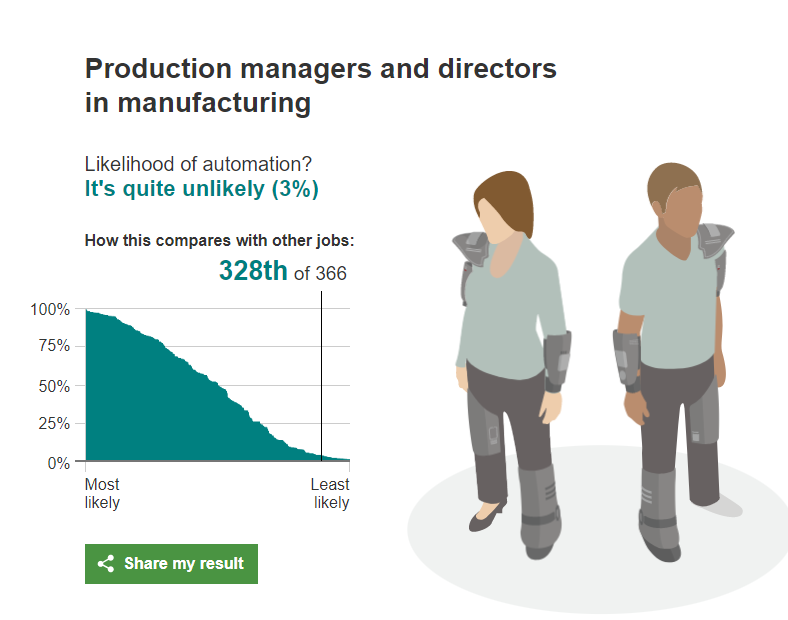
The BBC has designed an intriguingly eerie interactive infographic that predicts the probability of robots taking over your job.
Users can enter their profession or select from a vast array of options to view the corresponding percentage of their job's risk of being replaced by automation.
The interactive infographic is both compelling and alarming, providing users with a glimpse into the potential future of their careers.
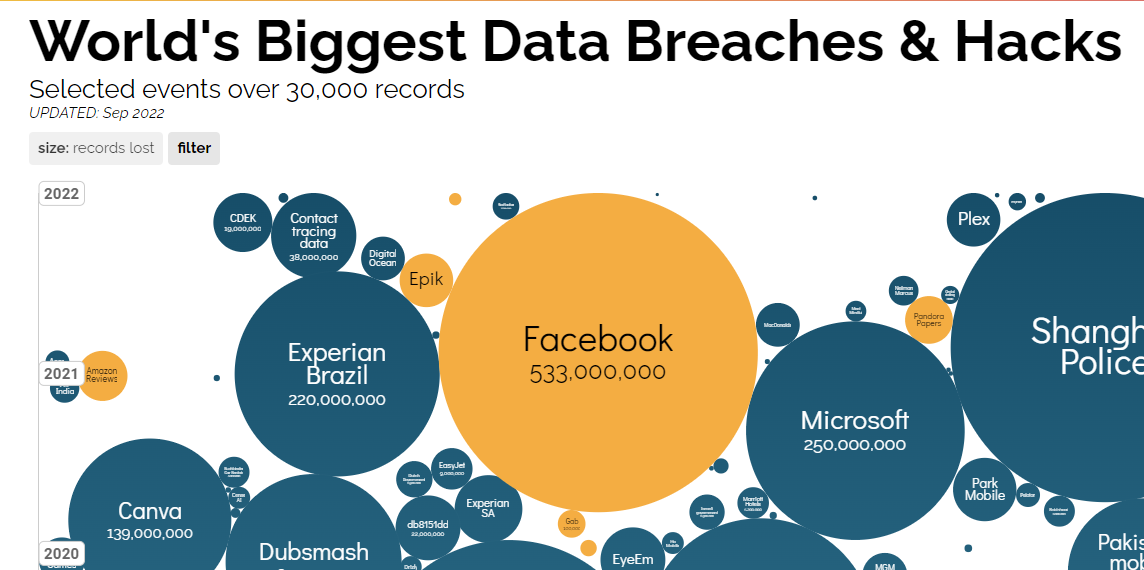
Data theft is a looming threat that affects everyone, but it's the big players that cybercriminals often target.
Thanks to this interactive infographic, you (and I) can now visualize the extent and frequency of data breaches affecting these large entities.
We can now see who's been hacked, the severity of the attacks, and the information that has been compromised.
It's a powerful tool that raises awareness of the pervasive nature of data theft and the importance of cybersecurity.
How To Make Interactive Infographics… Amazing?
If you plan to create interactive infographics, it can really be a game-changer in your engagement.
But let's face it, making them amazing is not as simple as just slapping on some fancy graphics and adding a few bells and whistles.
It takes some thought, creativity, and a bit of strategy.
First things first…
Let's Talk About Why Interactive Infographics Help Skyrocket Engagement
- For starters, according to a study, 79% of marketers see a marked increase in message retention when using interactive content. So, interactivity allows users to engage with the content on a deeper level, making it more engaging and memorable.
- It also helps brands stand out. According to a study, 85% of marketers are already using or planning to use interactive infographics as part of their strategy…in a bid to differentiate their brands from their competitors.
- Additionally, interactive infographics are more efficient in presenting information, reducing the risk of information overload and leading to better user engagement. (Up to twice the engagement rate in most cases.)
- And lastly, thanks to their immersive and flexible nature, interactive infographics are more likely to be shared on social media, expanding your reach and potential audience.
Tips For Making Great Interactive Infographics
1. First Up, Keep It Simple!
Nobody likes a complicated design that makes their head spin.
So, make your interactive infographic easy to use with simple navigation and clear instructions.
Think of it like baking a cake – the simpler the recipe, the more people will want to try it out.
But why stop there?
2. Gamify It!
Add some fun and excitement with interactive quizzes, games, and puzzles. (This is the whole essence of interactive infographics after all.)
Not only will this make your content more enjoyable, but it will also make it more memorable.
By adding a game element to your interactive infographic, you're giving your audience an experience they won't soon forget.
3. Oh, And Don't Forget To Enable Embedding!
Sharing is caring… and allowing users to embed your interactive infographic on their own sites or social media profiles is a surefire way to get more eyes on your content.
This means more exposure for you and more engagement for your content.
4. And Last But Not Least, Relevance Is Key!
Cover a story or topic that your audience cares about and make it come alive with your interactive magic.
Whether it's a trending topic or a timeless issue, your interactive infographic should speak to your audience's interests and values.
Final Remarks
With the right approach, interactive infographics have the potential to skyrocket engagement, increase comprehension, and promote social sharing, making them an essential tool in any content creator's arsenal.
So…by leveraging interactivity, gamification, and relevant storytelling, you can create a truly amazing and impactful interactive infographic that will REALLY capture your audience's attention.